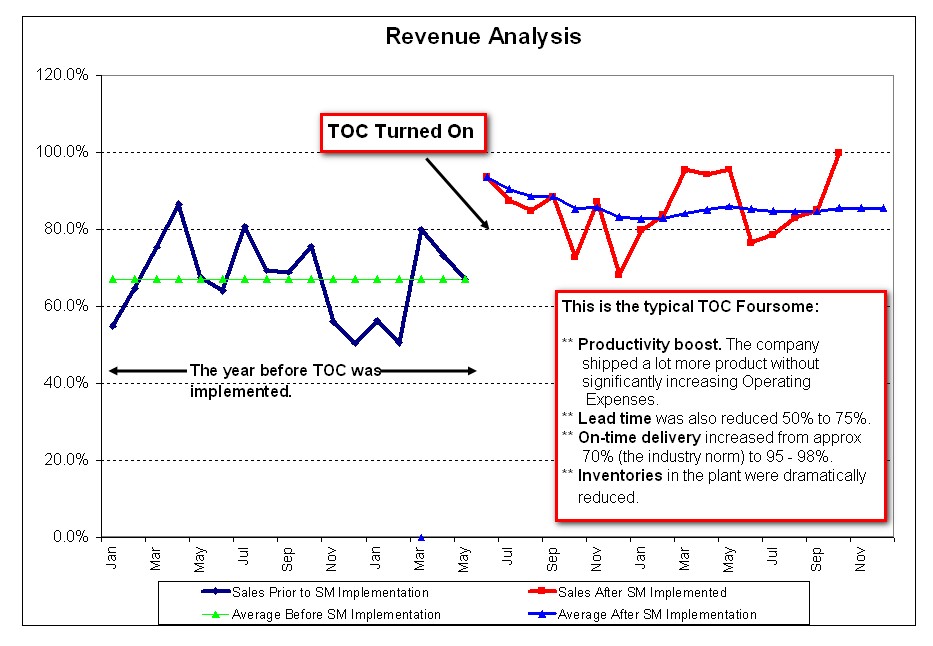
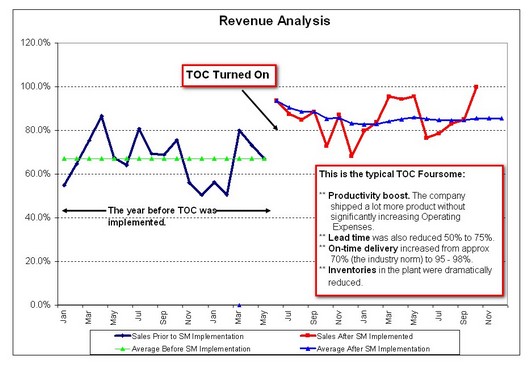
See the immediate large impact on productivity and on-time deliveries.
In Chart #1 (below) you can see an immediate 20% or so of additional shipped product when we turned TOC on, gained from the same resources. That was EXACTLY 90 days from when this client said "let's go."
To convert this into serious profit growth you have to have the sales to support the new production capability. If your current sales force cannot get you these sales, we probably can show you how.
Put numbers to this: a $5 million company, assuming material costs are 40% of sales, would be shipping $1 million MORE per year and seeing $600,000 fall to the bottom line per year from this performance improvement even if they never grew any more. (And they will). That's $50,000 a month.
Realistically, cash flow becomes the problem if we're not careful ... 20% more material has to be bought while the added revenue might be 30, 60 or more days later. This is only a termporary issue. Then the cash flows turns VERY positive.
What if, in reality, they had to add someone to shipping, perhaps someone else to cover for breaks on a certain machine ... they are still banking an added $600,000 for an added $60,000 of payroll. Would you go for that deal?
An incidental issue: this client’s on-time performance shifted to be the best in the marketplace. And, their lead time became the best in the marketplace.
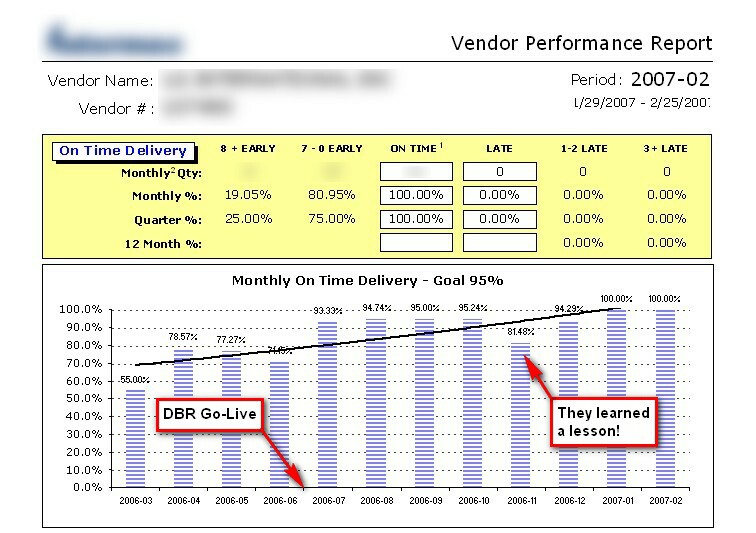
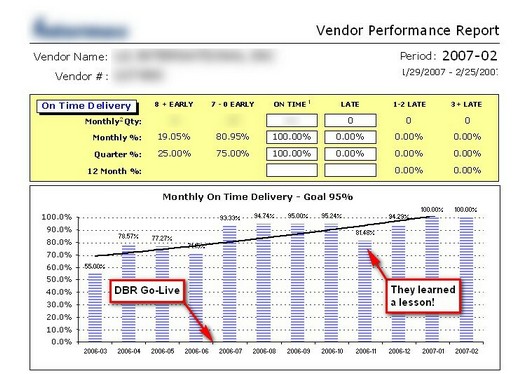
In Chart #2, with a different company, you see a different type of instant impact when they turned-on their new way of working – on-time performance jumped from the 70% range into the mid-90% range as soon as we went live with our solution. And then it continued to improve. This one took us nearly 150 days because we used data from their existing computer system, and they didn't have anyone in-house who knew that system ... so it was a chore. Otherwise, it, too would have been in under 90 days. But those are the realities we encounter.
Chart #1: The immediate impact on Productivity
(Click on the chart for a full-size version)
An immediate boost in on-time performance is followed by steady incremental improvement to the 100% level.
Chart #2 is actually a report generated by the customer of our client – one who naturally has a strong interest in seeing good on-time performance from their supplier.
It shows the initial boost in on-time performance at "Go Live," but then a steady improvement month after month until our client hit 100% in January.
The Blip in that pattern is a lesson learned – the system was flying red flags, we were personally warning the client of actions to be taken, the client did not respond in a timely manner ... and paid the price. They learned, and they will not do that again. For many companies, “good execution” has to be learned. It’s rarely a habit. That's one reason we do so much hand-holding after the "Go Live." (Also, dealing with the cause of the inaction – almost always a policy constraint – is an excellent opportunity for improvement, of course.)
It is also worth noting that the improvement in on-time delivery was achieved while the company was shipping record sales volumes, and capacity was loaded to record levels ... a situation that usually causes a deterioration in on-time performance.
Chart #2: The immediate and ongoing impact on on-time performance.
(Click on the chart for a full-size version)
Making sure that profit growth keeps pace with Revenue growth
This issue is very close to many companies' hearts as they grow.
Look at Chart #3: In the year before this client applied TOC they had some useful sales growth ... 21% ... but the Throughput (think of this as contribution margin) only grew 11% and their Operating Expenses grew by 16%. So while absolute profits increased, profitability decreased.
This type of growth performance is common, it’s frustrating for management, and it’s entirely avoidable with the Theory of Constraints.
To make things worse ... this company had to increase their inventories by 56% to cope with the sales growth! Again, a common situation.
Now, the next line of the Chart makes a comparison between performance during the first full year of the TOC implementation and the same “base” year that the previous line was compared to (i.e. it’s helping to compare how different the same-year performance would have been relative to the same starting point.)
Instead of growing 21%, revenues were 41% higher than in that base year. (We focused on adding new business). But this time the growth in the Throughput (Contribution) from those sales was almost in line with the growth in sales ... 35%. While the Operating Expenses grew only 11%. The profitability was not only maintained, it improved approximately 25%.
Incidentally, one major customer of our client – representing 40% of their business at the time – demanded a 33% across-the-board price cut and after the dust had settled our client STILL generated this level of performance. One reason we were hired was to help dilute the impact which senior management knew was coming ... I'd say we succeeded. (They agree).
When you can achieve results like this ... sales growth translates into serious profit growth.
And to make it sweeter ... they were operating with a LOT less inventory. And they'll also tell you their lead time was days compared to the industry standard 6 weeks; and their service level was the best in the industry (and it was recognized as such by their major customers, annually).
Chart #3: Making sure Sales growth translates to Profit growth
| Period |
Annual
Revenue $ |
Annual
Throughput $ |
Annual
Operating Expense $ |
Average Inventory $ |
Year
before
T
OC |
+21% |
+11% |
+16% |
+56% |
First Year
after TOC |
+41% |
+35% |
+11% |
-50% |
Chart #4 refers to a strange situation.
There were no Part numbers or Bills of Material or Routings, no data whatsoever, no computer systems. The generator kept quitting, dust extraction was down more often than up, and the owner didn't even invite us to work with him!
Yet results were spectacular.
The major customer of a small furniture maker hired us to improve their supplier’s performance! (They paid our fees.) Not the best starting posture for a win/win style consultant, where the owner is being told by a customer that "you will do this ..." We prefer to start with buy-in rather than a gun to the head.
The fee-paying customer provided services to hotels undergoing renovations, and on-time delivery was crucial – as was over-all good performance.
Initially, on-time delivery from this low-tech vendor was non-existent, there was a months-long backlog of work, and time in the plant itself (cycle time) could be 30 days or more.
To compound matters the plant had only a single manager (the owner), no bills of materials or routings or inventory records whatsoever ... their one ancient PC was for book-keeping.
Here are some of the results we generated (we had them buy a cheap PC with Excel and developed a push-button metrics package for the owner ... or else there would have been no performance measurements at all).
Chart #4: Cycle time and Quoted Lead times
(Click on the chart for a full-size version)
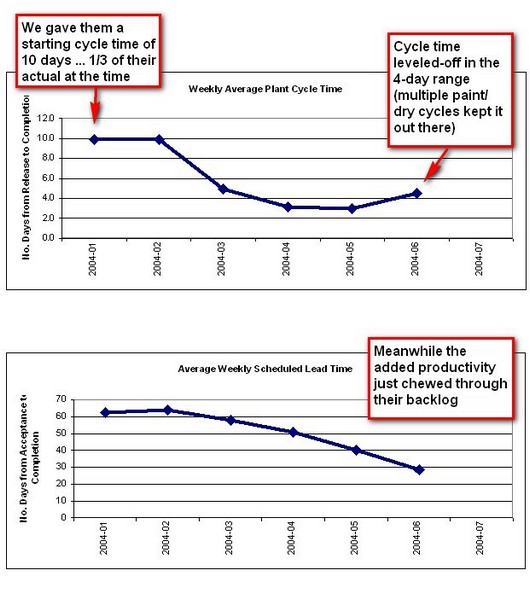
At the same time as these results were recorded, volume through the plant was growing – which is often a recipe for even-longer lead times, and worsening on-time delivery.
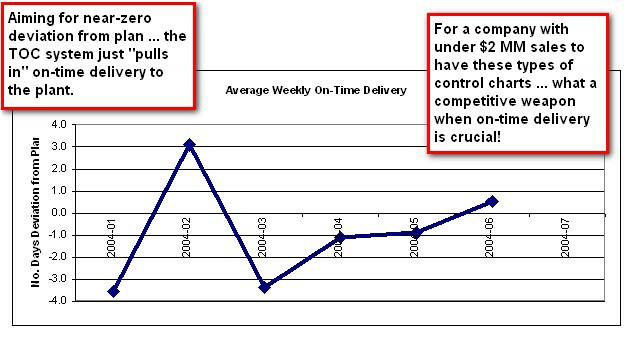
But this control chart shows what was happening with on-time delivery at this company:
Chart #5: On-time performance
(Click on the chart for a full-size version)
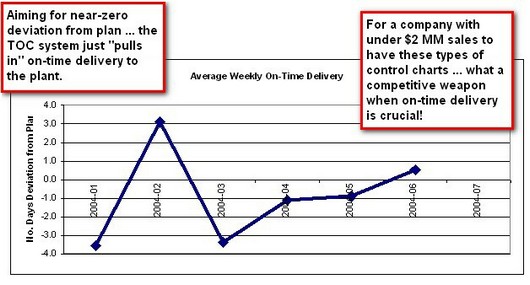
These results ... and others with this client ... were spectacular despite almost a worst case scenario – no data, no computer support, no managers to work with, no employees able to contribute ... we had to make it all happen, all the way. Not our preferred route, but sometimes necessary.
Take a minute to check out some client testimonials that add to this picture, too.
Or, home page: fast, massive performance improvements.
|