We show charts and graphs of some of our customer results below; or you can jump straight to Testimonials.
But there’s an important consideration: if the technology we advocate is solid, then you should be able to find a LOT of Theory of Constraints success stories, from a lot of different companies using a variety of different consultants.
So take a look at Synchronix’ results below; but also, Google:
theory of constraints success stories
and
toc success stories
… and you will find scores of stories of MASSIVE performance improvement in an extraordinarily wide range of organizations. Manufacturers. Distributors. The Church. Banks. The Military. Health care. State Government. Education.
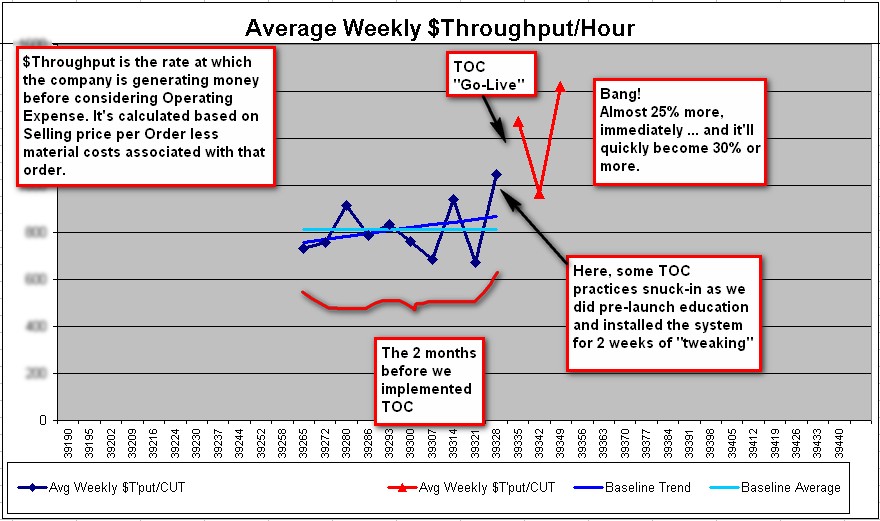
See the immediate large impact on productivity and on-time deliveries.
In Chart #1 (below) you can see results as we’re just 3 weeks in from Go Live with one client.
There are too few data points post-TOC for any kind of meaningful average but when we compare the past 3 weeks with the previous 2 months, we’re getting about 24% more Throughput per day. That means, for the same payroll and overhead etc (Operating Expense) this company is making 24% more money for every hour it operates. This will translate into a high-6-figure or even 7-figure profit boost for this small company in the next 12 months even if the data doesn’t trend-up – which it will.
Chart #1: The immediate impact on productivity
– click the image to see a larger version
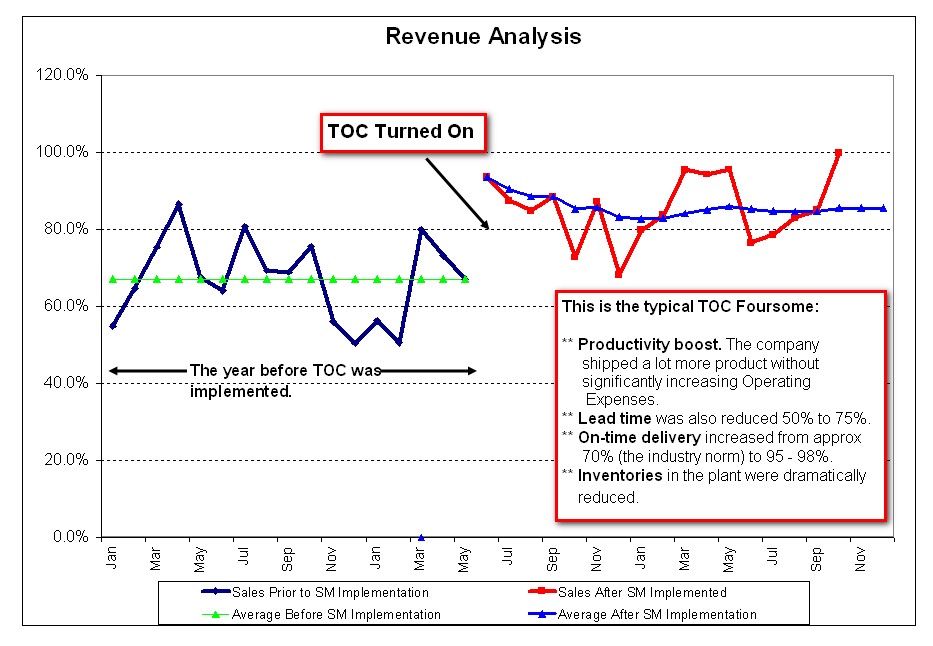
In Chart #2 (below) for a very different business you can once again see an immediate 20% or so of additional shipped product when we turned Theory of Constraints on, gained from the same resources. That was EXACTLY 90 days from when this client said “let’s do it.”
To convert this into serious profit growth you have to have the sales to support the new production capability. If your current sales force cannot get you these sales, we can probably show you and them how.
Again, put numbers to this: a $5 million company, assuming material costs are 40% of sales, would be shipping $1 million MORE per year and seeing $600,000 fall to the bottom line per year from this performance improvement even if they never grew any more or improved any more. (And they will.)
That’s $50,000 a month … probably for years.
So … what’s the value of the TOC implementation?
Realistically, cash flow can become a problem in the short-term if a company isn’t careful … 20% more material has to be bought while the payables/receivables cycle means the added revenue from those purchases might be 30, 60 or more days later. This is only a temporary issue. Then the cash flow turns VERY positive.
Also, the calculation earlier assumed they wouldn’t have to hire anyone or increase their Operating Expense. That’s how the $600,000 fell to the bottom line. But what if, in reality, they had to add someone to shipping, perhaps also someone else to cover for breaks on a certain machine? They are still banking an added $600,000 against an added $60,000 of payroll. Would you go for that deal?
At the same time … this client’s on-time performance shifted to be the best in the marketplace. And, their lead time became the best in the marketplace. This has some nice side-effects, one being that as demand grows they can cherry-pick the most profitable business.
Also, when they added a new facility to expand their product line, it was fully-booked even before they turned the power on because of their reputation for on-time performance with short lead times.
Chart #2: The immediate impact on Productivity
(Click on the chart for a full-size version)
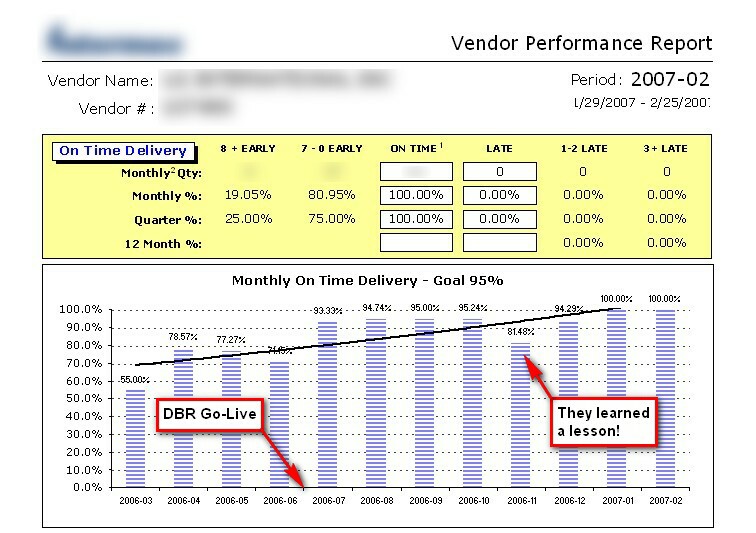
Next we have an immediate leap in on-time performance, followed by steady incremental improvement to the 100% level.
In Chart #3, with a different company again, you see a different type of instant impact when they turned-on their new way of working on-time performance jumped from the 70% range into the mid-90% range as soon as we went live with our solution. And then it continued to improve.
This one took us nearly 150 days to “Go Live” because we used data from their existing computer system, and they didn’t have anyone in-house who knew that system … so it was a chore as we had to dig everything out for ourselves. Otherwise, it, too would have been in place in less than 90 days. But this is typical of the realities we encounter.
This chart (#3) is actually a report generated by the customer of our client one who naturally has a strong interest in seeing good on-time performance from their supplier (our customer). It represents performance over a range of skus. You can see the initial boost in on-time performance at “Go Live,” but then a steady improvement month after month until our client hit 100% in January.
The Blip in that pattern could have been from any of several causes. Perhaps a materials problem, for example. Just as likely … a problem with execution. For many companies, good execution has to be learned. It’s rarely a habit. That’s one reason we do so much hand-holding after the “Go Live.”
What’s just as important as understanding the cause, is fixing the problem at the root-cause level. That’s what they did here, and you can see the results.
It is also worth noting that the improvement in on-time delivery was achieved while the company was shipping record sales volumes, and capacity was loaded to record levels … a situation that usually causes a deterioration in on-time performance.
Chart #3: The immediate and ongoing impact of on-time performance.
(Click on the chart for a full-size version)
NEXT: Making sure that Profit growth keeps pace with Revenue growth
This issue is very close to many companies’ hearts as they grow.
Look at Chart #4: In the year before this client applied TOC they had some useful sales growth … 21% … but the Throughput (think of this as contribution margin) only grew 11% and their Operating Expenses grew by 16%.
So while absolute profits increased, relative profitability decreased.
This might be OK when it’s a small shrinkage … but when the gap is as large as this, it’s a problem.
This type of growth performance is common, it’s frustrating for management, and it’s entirely avoidable with the Theory of Constraints.
To make things worse … before they adopted TOC practices, this company had to increase their inventories by 56% to cope with the sales growth! Again, a common situation.
Now, the next line of the Chart makes a comparison between performance during the first full year of the Theory of Constraints implementation and the same base year that the previous line was compared to (i.e. it’s providing a comparison to show how different the pre-TOC and post-TOC performance would have been relative to the same starting point).
Instead of growing 21%, revenues were 41% higher than in that base year. (We helped the client focus on adding new business.) But this time the growth in the Throughput (Contribution) from those sales was almost in line with the growth in sales … 35%. TRIPLE the pre-TOC performance. While the Operating Expenses grew only 11%.
The profitability was not only maintained, it improved approximately 25%.
Oh yes, and we reduced the inventory to about half the original starting point – not the starting point + 56%! – by about half, at the same time.
Incidentally, one major customer of our client representing 40% of their business at the time demanded a 33% across-the-board price cut and the results you’re seeing are AFTER that dust had settled.
Our client’s customer was riddled with poor policies and practices, and could NOT be assumed to act rationally, and one reason we were hired was to help dilute the impact of these types of changes, which senior management suspected were coming … I’d say we succeeded. (They agree.)
When you can achieve results like this … sales growth translates into serious profit growth.
And to make it sweeter … they were operating with a LOT less inventory. In an environment where shelf-life was a major issue. Also, their lead time from material receipt to product availability was 3 – 6 days compared to the industry standard 6 weeks; and their service level was the best in the industry (and it was recognized as such by their major customers, annually).
Chart #4: Making sure Sales growth translates to Profit growth
| Period | Annual Revenue $ |
Annual Throughput $ |
Annual Operating Expense $ |
Average Inventory $ |
| Year before TOC |
+21% | +11% | +16% | +56% |
| First Year after TOC |
+41% | +35% | +11% | -50% |
Sometimes we encounter some unusual situations.
Chart #5 is in reference to one example.
There were no Part numbers or Bills of Material or Routings, no data whatsoever, no computer systems beyond an aging PC the book-keeper used. In this company the generator kept quitting, dust extraction was down more often than up, … and the owner didn’t even invite us to work with him!
Yet results were spectacular.
The major customer of a small furniture maker hired us to improve their supplier’s performance! (Yes, they paid our fees.) Not the best starting posture for a win/win style consultant, where the owner is being told by a customer that “you will do this …” We prefer to start with buy-in rather than a gun to the head.
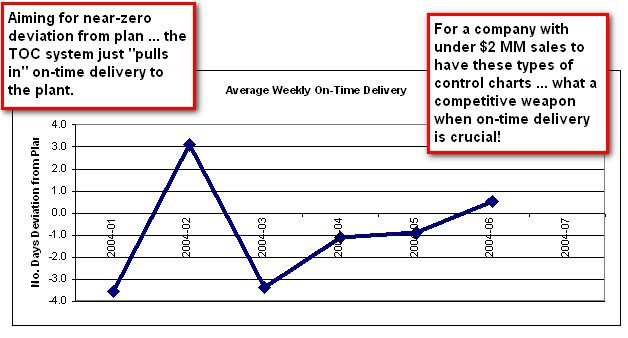
The fee-paying customer provided services where on-time delivery was crucial.
Initially, on-time delivery from this low-tech vendor was non-existent, there was a months-long backlog of work, and time in the plant itself (cycle time) could be 30 days or more.
To compound matters the plant had only a single manager (the owner), no bills of materials or routings or inventory records whatsoever … as I mentioned, their one ancient PC was for book-keeping.
Here are some of the results we generated. We had them buy a cheap PC with Excel, and along with the scheduling system we developed on Excel we also developed a push-button metrics package for the owner and their customer, our client … or else there would have been no performance measurements at all.
Chart #5: Cycle time and Quoted Lead times
(Click on the chart for a full-size version)
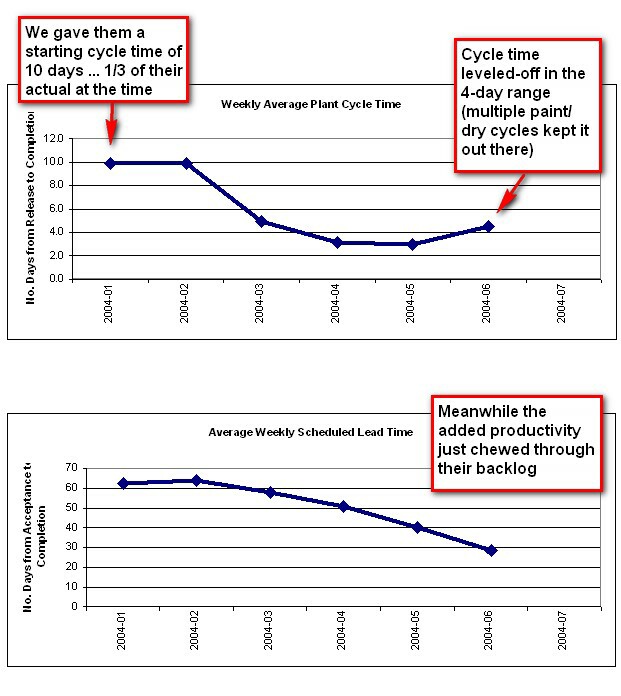
At the same time as these results were recorded, volume through the plant was growing which is often a recipe for even-longer lead times, and worsening on-time delivery.
But this control chart shows what was happening with on-time delivery at this company:
Chart #6: On-time performance
(Click on the chart for a full-size version)
These results … and others with this client … were spectacular despite almost a worst case scenario no data, no computer support, no managers to work with, no employees able to contribute … we had to make it all happen, all the way. Not our preferred route, but sometimes necessary.
If you want to move away from data to opinions … here are some client testimonials that also tell a story.
Are you interested in learning more about how to see results like these in YOUR company?
It’s an easy first step: Call Steve Jackson at 604-668-3253.